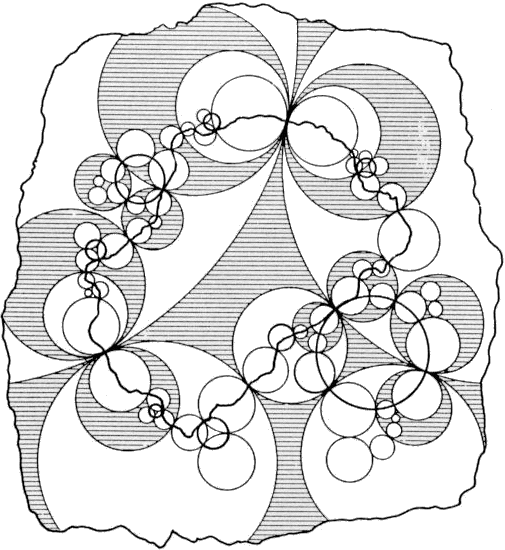
I recently saw this classic image from over a century ago attempting to illustrate the limit set of a reflection group.

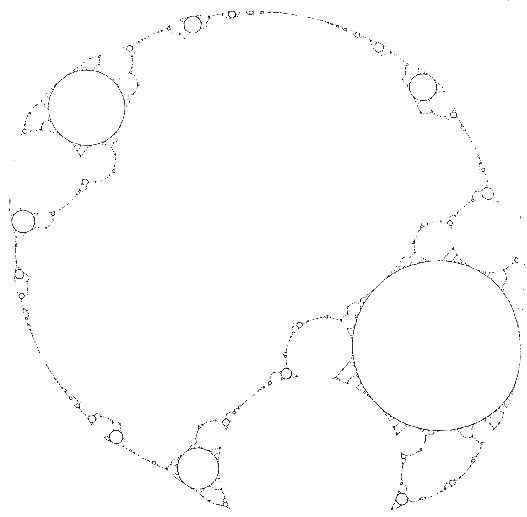
Benoit Mandelbrot computed a more exact version a few decades ago.

Mandelbrot’s version is more correct as far as the limit set goes, but it doesn’t show the tessellation (the white and shaded regions in the first drawing). The software I’ve been building should do a better job of showing both the limit set and tessellation. But that’s a project for a bit later.
Jan 25, 2010: In a comment to this post, Xavier Buff has pointed out that the limit set and tessellation have been computed at http://images.math.cnrs.fr/Un-ensemble-limite.html. The pictures there are very nice, especially since separate components of the fundamental region have been give different colorings. The site contains other mathematical visualizations as well – you can browse at http://images.math.cnrs.fr/-Images-et-visualisation-.html.
You may get a look at http://images.math.cnrs.fr/Un-ensemble-limite.html
LikeLike